
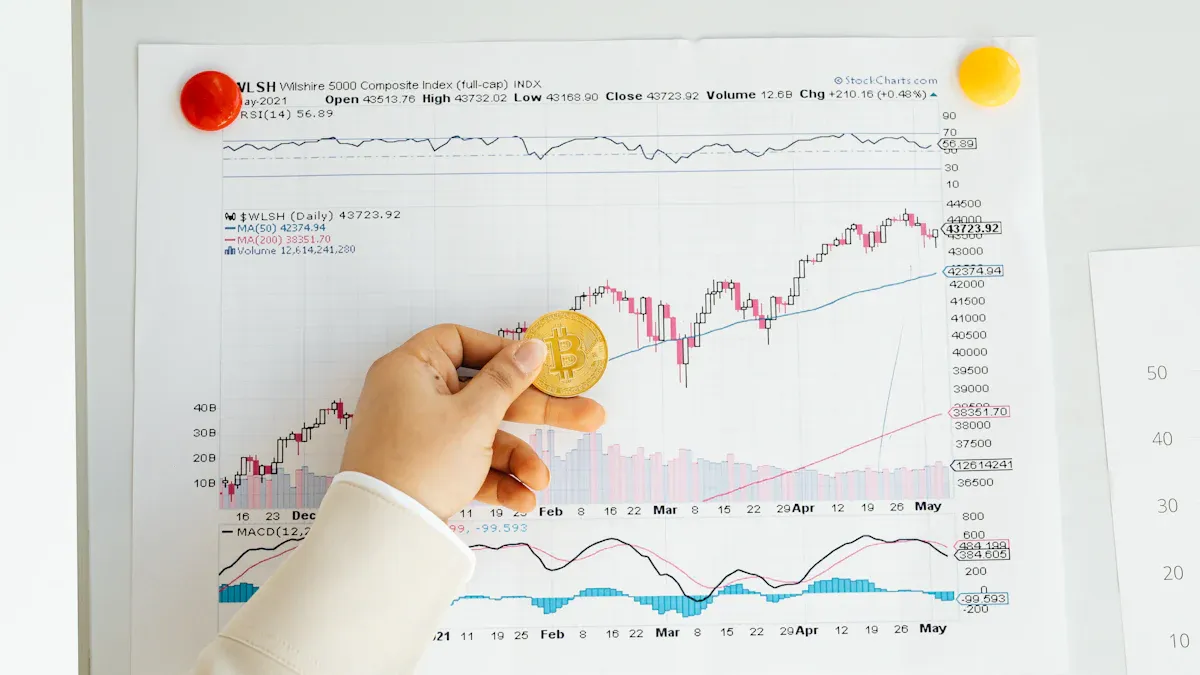
You want to trade better, so you need to know if bullish or bearish RSI divergence helps more. Both types of RSI divergence can help you make smarter trading choices. Studies show RSI divergence signals on daily charts work about 60% to 65% of the time when you check them with other tools. This number can go over 70% if you use RSI at very high or low levels and add support or resistance. Bullish divergence RSI has helped traders find market bottoms about 68% of the time within three candles of the real low. When you use RSI and trading signals together, you raise your chances of making good trades. You can find better chances when you know how RSI fits in your trading plan.
Key Takeaways
Bullish and bearish RSI divergence can show when trends might change. These give you early hints to help you trade better.
Use RSI divergence with other tools like support and resistance. You can also use volume or candlestick patterns. This helps confirm signals and lowers your chances of making mistakes.
Bullish divergence means sellers are getting weaker in downtrends. This can help you spot good times to buy near the bottom.
Bearish divergence means buyers are losing power in uptrends. This helps you get ready for price drops or chances to sell.
Always use good risk management by setting stop-loss and take-profit levels. Test your plan with backtesting or paper trading first.
RSI Divergence
What Is RSI Divergence
RSI divergence helps you notice when the market is changing. It happens if the price and RSI move in different ways. When the price drops lower but RSI does not, that is bullish divergence. If the price goes higher but RSI does not, that is bearish divergence. The RSI divergence indicator uses a 14-period RSI to check price strength. You look for overbought above 70 and oversold below 30. Seeing divergence at these levels gives a strong trading signal. Marking where divergence starts and ends on your chart shows momentum changes. You can use set take profit and stop loss levels to control risk. This way is the main part of divergence analysis.
Tip: Always make sure RSI divergence matches other signals, like support or resistance, for better results.
Why RSI Divergence Matters
You want to make good trading choices. The RSI divergence indicator warns you early about trend changes. It works best when you use it with other tools, like moving averages or Bollinger Bands. Using more tools helps you control risk and avoid bad signals. Past data shows RSI divergence can work 55% to 65% of the time on forex pairs. If you adjust your RSI settings and check more than one timeframe, you can get up to 20% better results. RSI divergence is very useful in wild markets because it helps you spot reversals and manage risk. You can use divergence analysis to pick better entry and exit points. This makes your trades work better. The RSI divergence indicator is important in many trading plans because it shows when momentum is slowing down.
Use RSI divergence to:
Find trend reversals
Time your entries and exits better
Make your risk management stronger
Bullish Divergence RSI
Definition and Signals
Bullish divergence RSI helps you see when a downtrend might stop. You notice this when the price keeps making lower lows, but the RSI shows higher lows at the same time. This means sellers are not as strong, even if prices keep dropping. The bullish divergence signal can show up before a trend changes, so you might spot market bottoms early.
Defining criteria for bullish divergence:
Price keeps making lower lows.
RSI or other momentum indicators, like MACD or Stochastic Oscillator, make higher lows.
This tells you sellers are getting weaker and a bullish reversal could happen soon.
If volume stays the same or gets smaller during price drops, the signal is stronger.
Other tools, like candlestick patterns or trendline breaks, can help you feel more sure.
In the past, bullish divergence showed up before big market recoveries, like in 2008 and March 2020. These times show how bullish divergence RSI can warn you about market reversals.
Tip: Look for bullish divergence RSI near strong support or after a long downtrend for better results.
How to Identify Bullish Divergence
You can find bullish divergence RSI by following some easy steps. First, pick a momentum indicator, like RSI, on your chart. Then, look for the latest swing lows in the price. Watch if the price makes a new lower low, but the RSI makes a higher low at the same time. This pattern is the main sign of bullish divergence.
Pick RSI or another momentum indicator.
Find two or more recent swing lows in the price.
Check if the price makes lower lows while RSI makes higher lows.
Use other tools, like bullish candlestick patterns or a break above resistance, to confirm.
Enter a long trade if you get confirmation.
Put your stop-loss below the latest swing low to manage risk.
You can also check more than one timeframe. If you see bullish divergence RSI on both daily and four-hour charts, the signal is stronger. Many traders use RSI divergence with moving averages, MACD, or volume analysis to get better results. Practice with backtesting and paper trading to get good at spotting these patterns.
Trading Implications
Bullish divergence RSI lets you enter trades before most people do. When you see this signal, it means the downtrend is getting weaker. You can use it to plan long trades and try to catch a new uptrend. Many traders wait for more proof, like a bullish engulfing candle or a break above a key resistance, before they enter.
Old trading data shows bullish divergence often comes before prices go up. For example, if a stock keeps making new lows but the RSI goes up, sellers are losing power. If you add other signals, like rising volume or a positive tick index, your trade setup is even stronger. This way, you can spot reversals early and manage risk better.
Note: Bullish divergence RSI works best with other tools. Do not trust just one signal.
Pros and Cons
You should know the good and bad sides of bullish divergence RSI before using it.
Pros | Cons |
|---|---|
Early warning for trend reversals | False signals in wild markets |
Helps you find long trade setups | Needs other indicators to confirm |
Works well with more than one timeframe | Weak signals can lower win rates |
Makes risk management better with clear stop-loss | Overtrading on small divergence can hurt results |
Strong signals on higher timeframes have high win rates | Ignoring trend direction lowers accuracy |
Advantages:
Strong bullish divergence RSI signals on higher timeframes can give you win rates between 65% and 75%.
Using more indicators and timeframes makes you more accurate.
Good risk management, like using stop-loss orders, helps you lose less.
Waiting for the best setups helps you avoid emotional trades.
Limitations:
Weak or small divergence signals can lower your win rate and cost more.
Overtrading and ignoring the main trend can make you lose money.
Bad risk control can erase gains, even if you spot the right signals.
Tip: Always check bullish divergence RSI with other tools, like candlestick patterns, support and resistance, or volume analysis. This helps you avoid false signals and trade better.
Bearish Divergence
Definition and Signals
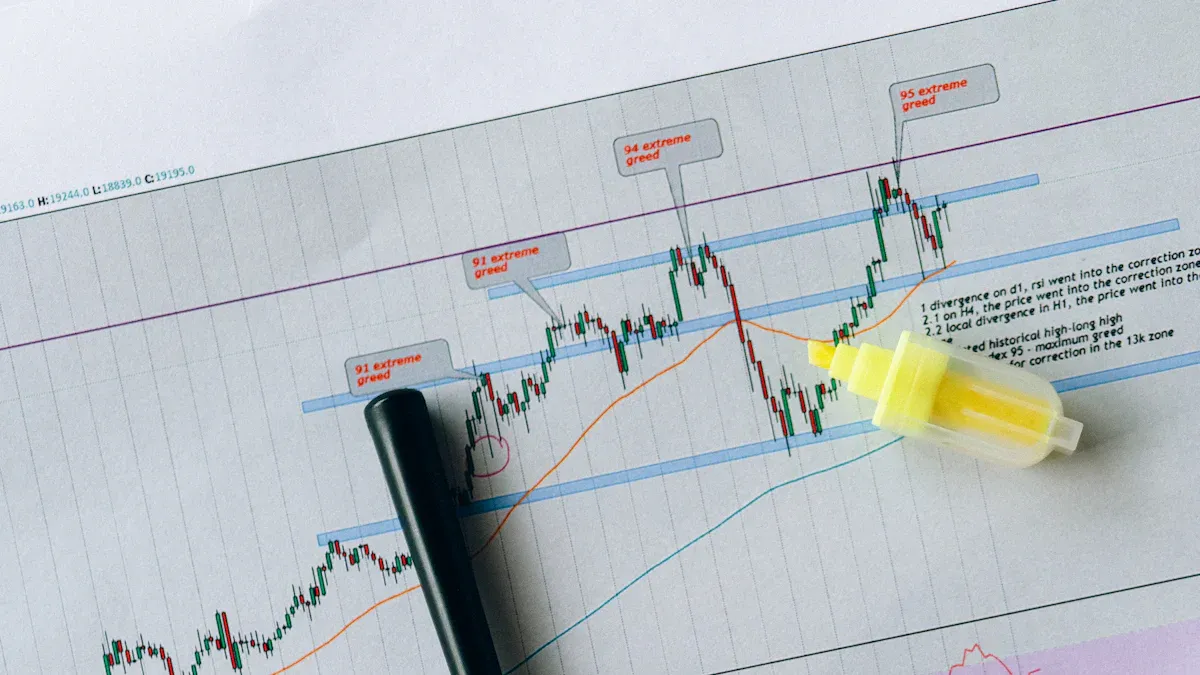
Bearish divergence is a sign that an uptrend might stop soon. You see it when the price makes higher highs, but the rsi makes lower highs. This means buyers are not as strong, even if prices go up. The rsi divergence formula checks average gains and losses. If the rsi does not match new price highs, the move is losing strength.
Bearish divergence happens when:
Price makes a higher high.
rsi forms a lower high at the same time.
This shows buying power is getting weaker.
You often see it near resistance or after a big rally.
You can confirm it with bearish candlestick patterns, trendline breaks, or rsi dropping below 70.
Bearish divergence warns you early that a trend could reverse. You can use this signal to get ready for changes and protect your trades.
How to Identify Bearish Divergence
You can find bearish divergence by following some easy steps. First, add the rsi indicator to your chart. Next, look for two or more recent swing highs in the price. If the price makes a new higher high, but the rsi makes a lower high, you have bearish divergence. This means the uptrend is getting weaker.
Steps to spot bearish divergence:
Add rsi to your trading chart.
Find two or more swing highs in the price.
Check if the price makes higher highs while rsi makes lower highs.
Look for proof with bearish candlestick patterns, resistance, or less volume.
Use other indicators like MACD, Stochastic Oscillator, or On-Balance Volume for more proof.
Technical Signals / Indicators | Methodology / Pattern Recognition | Empirical Data / Validation |
|---|---|---|
MACD, DMI, rsi, Stochastic Oscillator, On-Balance Volume (OBV) | Look at the last 5-6 pivot points to find trend lines; check trend lines backward to confirm divergence; spot patterns like Rising Wedge (bearish), Falling Wedge (bullish), Diverging Triangles | Backtesting and old results support the indicator’s use; you can test your own strategies to check bearish divergence signals |
You can also use chart patterns like Head and Shoulders, Double Top, or Descending Triangle to confirm bearish divergence. These patterns often show up when bearish divergence signals a trend change.
Trading Implications
Bearish divergence lets you act before a trend changes. When you see bearish divergence, buyers are getting weaker. This is your sign to look for short trades or protect your gains. Bearish divergence often shows up when the rsi is above 70, which means overbought. You can use this signal to catch reversals early.
Recent studies show bearish divergence works best near resistance, Fibonacci retracements, or moving averages. For example, the S&P 500 weekly chart in late 2021 had bearish divergence before a big drop. Apple Inc. also had bearish divergence as its price went up but rsi fell, warning traders of a downtrend.
Bearish divergence gives you faster signals than some other indicators, like MACD. You can use bearish divergence in wild or sideways markets to spot quick changes. Always use bearish divergence with other tools, like volume analysis or candlestick patterns, for better results.
Bearish Pattern | Practical Outcome | Success Rate | Key Trading Techniques |
|---|---|---|---|
Head and Shoulders | Shows bearish reversals; enter after neckline break with volume confirmation | 93% | Enter after price breaks neckline; stop-loss above right shoulder; volume spikes confirm breakout |
Double Top | Shows resistance failure and price drop; confirmed by neckline break | 72% | Enter after break below neckline; use rsi above 70 for proof; stop-loss above resistance level |
Descending Triangle | Shows bearish trend continues; breakout below support level | 64% | Enter on close below support; volume gets smaller during pattern; stop-loss above recent lower high |
You should always set clear stop-loss and profit targets when trading bearish divergence. This helps you manage risk and avoid big losses. Checking more than one timeframe, like daily and 4-hour charts, can make your bearish divergence signals stronger.
Tip: Use bearish divergence with rsi, MACD, and volume analysis for the best results.
Pros and Cons
Bearish divergence has good and bad sides. You need to know both to use it well.
Aspect | Explanation |
|---|---|
– Shows weaker upward momentum and possible trend reversal. | |
Cons of Bearish Divergence | – Can give false signals, especially in strong or sideways markets. |
Bearish divergence helps you see when an uptrend is losing power. You can use it to find short trades and avoid buying at the top. The rsi divergence signal is easy to spot and works well with other indicators. But bearish divergence can give false signals, especially in strong trends. You should always check bearish divergence with price action or other technical tools.
Bearish divergence is not perfect. Sometimes, the price keeps rising even when rsi shows divergence. You need to use stop-loss orders and manage your risk. Using bearish divergence with other indicators, like MACD or volume, can help you avoid mistakes.
Note: Bearish divergence is a strong tool, but do not use it alone. Always look for confirmation and use good risk management when you trade.
Hidden Divergence
Hidden Bullish Divergence
You can find hidden bullish divergence when the price chart shows higher lows, but the RSI or MACD makes lower lows. This pattern means the uptrend will probably keep going. When you see this, the market is just taking a break, but buyers are still in charge. You should look for this signal during pullbacks in an uptrend.
Here’s how to spot hidden bullish divergence: First, check if the price makes a higher low. Next, see if the RSI or MACD makes a lower low at the same time. Try using both indicators together for better proof. Look at price peaks and valleys to find mismatches. Add trendlines or support levels to make your setup stronger.
Hidden bullish divergence works best with other tools. You can use it to enter trades early and follow the trend as it moves up.
Tip: Always use hidden bullish divergence with risk management, like stop-loss orders, to keep your trades safe.
Hidden Bearish Divergence
Hidden bearish divergence happens when the price makes a lower high, but the RSI or another momentum indicator makes a higher high. This pattern means the downtrend will likely keep going. You often see this during rallies in a downtrend, showing sellers are still strong.
To find hidden bearish divergence, do these steps: First, spot a downtrend with lower highs on the price chart. Then, watch for the RSI to make a higher high while the price makes a lower high. Check if the RSI goes above 50 and then drops back below. Use other tools like Fibonacci retracement or Bollinger Bands for extra proof.
This type of divergence helps you avoid bad signals and stick with the main trend. You can use it to plan short trades or manage your risk during pullbacks.
Note: Hidden bearish divergence works better in strong trends and when you use it with other indicators.
Trading Use Cases
You can use hidden divergence to make your trading better in many ways. This type of divergence helps you stay with the trend instead of trying to catch every reversal. Here are some ways to use hidden divergence:
Make sure the trend will keep going before you trade.
Use hidden divergence with MACD, volume, or candlestick patterns for stronger signals.
Put stop-loss orders near recent highs or lows to control risk.
Test your strategy and look for hidden divergence on different timeframes.
Try hidden divergence in stocks, forex, or crypto markets.
Hidden divergence gives you an advantage by showing when the trend will likely keep going. You can use it to avoid leaving trades too soon and catch bigger moves. Many traders see better results when they use hidden divergence with other tools.
Key Differences
Bullish vs Bearish Divergence
It is important to know how bullish and bearish divergence are different when you use rsi divergence in trading. Bullish divergence happens if the price keeps going lower, but the rsi starts to go higher. This pattern means sellers are not as strong, and the price might go up soon. Bearish divergence is the other way around. You see it when the price keeps going higher, but the rsi goes lower. This means buyers are losing power, and the price could drop. Both types of divergence help you see when momentum is changing. You can use them to pick better times to buy or sell.
Divergence Type | Reliability Rating | Optimal Market Conditions |
|---|---|---|
Bullish Divergence | High | Ranging or Downtrending Markets |
Bearish Divergence | High | Ranging or Uptrending Markets |
The table shows bullish divergence works best when the market is flat or going down. Bearish divergence is more useful when the market is flat or moving up.
Impact on Trading Outcomes
Using rsi divergence can help you get better trading results. Regular divergence tells you when a trend might change direction. Bullish divergence helps you find the bottom of the market, while bearish divergence warns you before the top. Hidden divergence means the trend will probably keep going. You can use rsi, MACD, or Stochastic Oscillator to look for divergence. Adding support and resistance or checking more than one timeframe makes your signals stronger. Good risk management, like using stop-loss orders, helps you avoid big losses. Using divergence helps you choose better times to trade and gives you a better chance to win.
Regular divergence helps you see when the market might turn.
Hidden divergence shows the trend will likely keep going.
Do not trade only because you see divergence.
Reliability and Use Cases
How well rsi divergence works depends on the market you are trading. In trending markets, divergence can show when a trend might stop or slow down. In sideways markets, it can show breakouts or fake moves. Both bearish and bullish divergence work in forex, stocks, and crypto. You should always check divergence with other indicators. Sometimes, divergence gives wrong signals, especially when the market is wild. Using divergence with rsi and other tools helps you spot changes and manage risk. You can use divergence to set stop-loss levels and plan your trades. Remember, you get the best results when you use divergence as part of a bigger trading plan.
Using RSI Divergence in Trading
When to Use Each Divergence
Knowing when to use bullish or bearish divergence helps you trade better. Bullish divergence is best during a local downtrend. The price keeps dropping to new lows, but the rsi shows higher lows. This means the sellers are getting weaker. Bearish divergence happens in a local uptrend. The price makes new highs, but the rsi makes lower highs. This shows buyers are losing strength. Always check what the market trend is before you trade. Use longer charts, like 4-hour or daily, for stronger signals. The table below shows when to use each divergence type:
Criteria | Bullish Divergence | Bearish Divergence |
|---|---|---|
Momentum Indication | Bearish momentum fading | Bullish momentum weakening |
Price and Oscillator | Price: lower lows; rsi: higher lows | Price: higher highs; rsi: lower highs |
Market Trend Context | Local downtrend | Local uptrend |
Signal Implication | Possible reversal or pause in downtrend | Possible decline after upswing |
Timeframe Consideration | 4H, daily (stronger signals) | 4H, daily (stronger signals) |
Never use rsi divergence by itself. Always add other trading strategies for better results.
Risk Management Tips
You need good risk management to trade rsi divergence well. Set clear rules for when to enter and exit trades. Always use stop-loss and take-profit orders to protect your money. Pick your trade size based on how much you can risk. Use rsi divergence with other indicators, like moving averages or volume, to avoid bad signals. Practice your plan with backtesting and paper trading. Change your rsi settings to match the market you trade. Keep a trading journal to track your trades and check your plan often. Smart tools, like automatic stop-loss, help you control risk. Always have a backup plan for surprises.
Use rsi divergence with other indicators.
Set stop-loss and take-profit targets.
Practice your plan with backtesting and paper trading.
Change rsi settings for your market.
Keep a trading journal and review your plan.
Tip: Good risk management keeps your losses small and helps you keep trading.
Confirming RSI Divergence
You can make your rsi divergence trades better by checking signals with other tools. Use rsi with MACD, Stochastics, or volume indicators. If all three show divergence, your signal is much stronger. Volume tools, like On-Balance Volume, help you see if the trend is real. Trading platforms like TradingView let you use many signals and get alerts right away. Backtesting shows that using rsi and MACD together can win up to 73% of the time. Always check more than one chart timeframe for better results. Keep learning and update your plan as markets change. To master rsi divergence, always use confirmation and manage your risk every time you trade.
Note: The best way to trade rsi divergence is to use more than one indicator, check volume, and follow your rules. This helps you avoid bad signals and get better results with rsi.
If you learn about both bullish and bearish RSI divergence, you can make better trades. Each one tells you something different about how the market is moving. Try to find these patterns on your charts often. Always use stop-loss orders to keep your trades safe.
Check your charts for RSI divergence now.
Remember: Practicing a lot helps you get better at finding good trades.
FAQ
What is the main difference between bullish and bearish RSI divergence?
Bullish RSI divergence tells you sellers are getting weaker. This means the price might go up soon. Bearish RSI divergence shows buyers are losing strength. The price could start to fall after that.
Can you use RSI divergence on any timeframe?
You can use RSI divergence on any chart you want. Stronger signals usually show up on 4-hour or daily charts. Shorter charts can give more fake signals.
How do you confirm an RSI divergence signal?
You check RSI divergence by using other indicators too. Try looking at MACD or volume for more proof. Chart patterns or candlestick shapes can also help. Always use more than one tool to be sure.
Does RSI divergence work in all markets?
You can use RSI divergence in stocks, forex, or crypto. It works best when the market is trending or moving in a range. Wild or sideways markets can give more fake signals.
Should you trade every RSI divergence you see?
You should not trade every time you see RSI divergence. Wait until other tools confirm the signal. Always use stop-loss orders to keep your trades safe. Practice helps you find the best setups.

